
“Despite being regularly referred to as the ‘gold standard’, pure tone audiometry, as it currently stands, has a very high degree of potential error, particularly in a clinical environment.”
Marine and Technology Faculty, Southampton Solent University, 2015
“A single determination of hearing threshold level at any frequency must be recognised as only a guess of unknown accuracy.”
“For an individual test subject, a single audiogram is an unconfirmed determination of that individual’s state-of-hearing in both ears. Put more starkly, a single audiogram is a guess.”
Institute of Sound & Vibration Research, University of Southampton, ISVR Technical Report No. 336, 2015
INTRODUCTION
If audiometry is properly carried out in accordance with the British Society of Audiology’s (BSA) recommended procedures for pure tone audiometry,[i] then can NIHL be reliably diagnosed based on a single audiogram?
Can NIHL claims handling schemes based upon a single audiogram simplify and speed up the claims process and reduce claim costs?
In a seminar held this week by the Manchester Law Society on NIHL claims (‘What’s all the noise about Noise Induced Hearing Loss’[ii]), Dominic Weir of Slater & Gordon, Karen Jackson of Roberts Jackson, Zoe Holland of Zebra LC[iii] and HHJ Gore QC advanced arguments in favour of a ‘single trusted audiogram’ during a panel discussion. Such arguments also appear to be finding increasing favour in the defendant community.
In this feature we consider audiometric reliability and the diagnosis of NIHL and why, in our view, single audiometry handling schemes would lead to more paid NIHL claims and re-ignite a currently declining market.
AUDIOMETRIC VARIABILITY
Pure tone audiometry has now been in use for over 90 years and has been described as the ‘Gold Standard’ for the assessment of hearing thresholds. Nevertheless it is accepted not to be a precise science - measurements are susceptible to errors, which may lead to variability in the results, and a lack of reliability. Stephens (1981)[iv] found 38 sources of error in audiometric testing.
The American Academy of Otolaryngology - Head and Neck Surgery,[v] list the variables in 4 principle categories and we set out some examples of the sources of error below:
Measures such as calibration of the test environment, equipment and procedure to ISO standards can reduce the risk of errors. There are both British and international standards for the test procedures. The BSA has published recommended procedures for pure tone audiometry which are in accordance with the International & British Standard BS EN ISO 8253-1. However, despite the use of these standards and recommended procedures, measurement variability is still inevitable. It is entirely normal to have 5 to 10dB differences in thresholds - in either direction - between properly conducted hearing tests.
This measurement variability has long been recognised. Chapter 5, section 5.2.3.1 of the Black Book, [vi] states that:
As was stated by HHJ Inglis in the Nottingham Textile Litigation judgment at 1st instance,[vii] at paragraph 103:
“The central tool in diagnosis is the audiogram. Audiograms are taken in steps of 5 dB at each frequency. They are variable and not generally exactly repeatable. Where 2 audiograms taken at about the same time vary, the results where there is variation may reasonably be averaged if the difference is not more than 10 dB. Up to 10 dB is therefore an acceptable margin of error”.
It is important to remember that this degree of ‘acceptable margin of error’ can occur where 2 audiograms are performed entirely properly by experienced audiologists within a proper test environment and calibrated equipment and applying BSA recommended procedures in testing.
If one test (or both) is not properly conducted then the margin of error and variability in measured thresholds between tests can be far greater. Some sources of audiometric error can result in better than actual hearing - so for example where a patient can see the audiometer and when a test signal is applied or there is a lack of variation in the test signals so the patient anticipates hearing a sound rather than actually doing so. The vast majority of errors however increase the measured hearing thresholds - in other words show hearing worse than it actually is. As stated by Lawton (1991)[viii]:
‘…systemic errors [in pure tone audiometry] usually work to elevate the threshold, to make the hearing appear less acute than it really is’.
However, a series of studies carried out by the Maritime and Technology Faculty of the Southampton Solent University between 2013-2015[ix] [x] [xi],suggest that the degree of accuracy of properly conducted audiometry is actually worse than previously thought.
One of these studies aimed to assess how measurements might vary between audiometers in a laboratory environment due to any calibration differences. Calibration requirements of audiometers are set out in various national and international standards,[xii] to ensure their sound outputs are within tolerances of -/+3 dB at frequencies 125Hz-4 kHz and +/-5dB at higher frequencies. Therefore 2 properly calibrated audiometers can differ in their sound outputs by up to 6 dB-10 dB dependent on frequency tested.
The study looked at the variability in sound output from 4 different types of audiometer which had all undergone proper laboratory calibration within the last 3 months. The sound output from the audiometers was measured using a Head and Torso Simulator (HATS) - as pictured below.
Picture; Bruel and Kjaer Head and Torso Simulator[xiii]
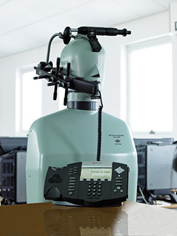
The HATS accurately replicates the size and shape of the human head and ears and allows the accurate measurement of sound which would be presented to the ear of a person undergoing audiometry - rather than the measured hearing thresholds of the person. In this way many of the environmental and the subjective sources of error which can occur are avoided.
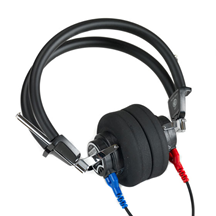
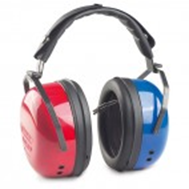
All the audiometers which used TDH39 headphones were fitted by a qualified audiometrist to the HATS. Three of the audiometers used supral-aural (sit on the outside of the ear) THD39 earphones and one used THD39 earphones with attenuating cups. Attenuating cups are noise excluding cups which can be fitted around the earphones to exclude external noise and are particularly recommended where the ambient noise level of the test environment is not ideal and commonly used in industrial screening situations.
Picture: THD39 earphones
Picture: Attenuating audiocups
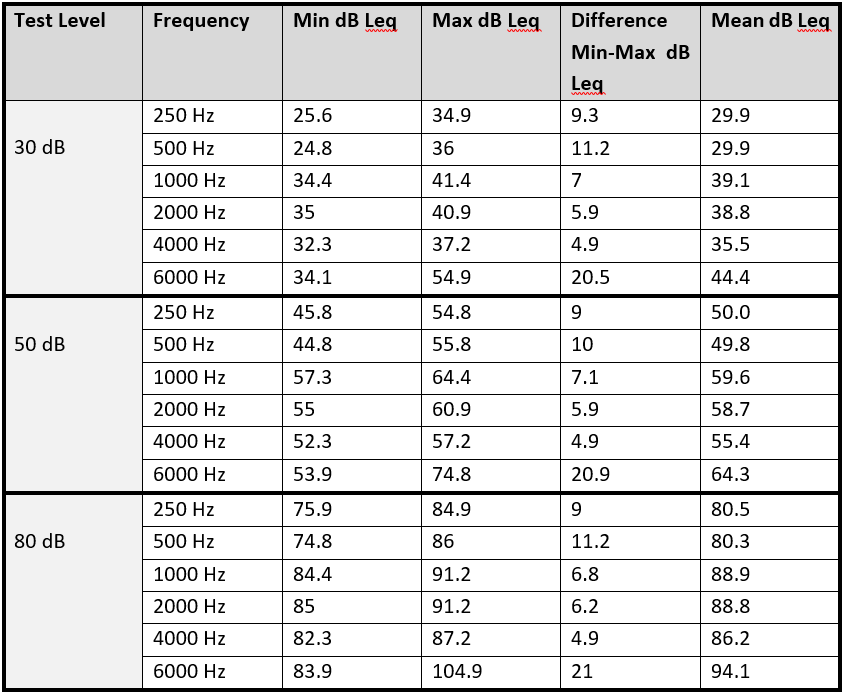
Sound was presented to the HATS using each of the 4 audiometers across the frequencies of 250 Hz, 500 Hz, 1 kHz, 2 kHz, 4 kHz and 6 kHz at assumed sound outputs of 30 dB, 50 dB and 80 dB. Both ‘ears’ were tested and tests were repeated 3 times with the headphones removed and replaced between each test.
In theory each audiometer should present identical tones with the HATS recording the same outputs. Surprisingly the measured outputs of the audiometers, which were apparently presenting the same sound frequency and level to the HATS, showed a high degree of test-retest variability - both within the same audiometer, between the different audiometers and between left and right ‘ears’.
The differences between the means outputs of each of the audiometers were between 3 and 12 dB. The variation in produced tones was greatest both within and between audiometers at 6 kHz with a maximum difference of 20-21 dB - far outside the calibration tolerances of 10dB. The results are reproduced in the table below.
Table: Minimum, maximum, difference and mean measured sound outputs at test levels & frequencies
The audiometer using attenuating cups had greater variation than the other audiometers in the study. It also had a significantly higher output level than the other audiometers at a number of frequencies. The authors suggest that a reason for this might be that the use of attenuating cups creates a calibration error. The attenuating cups themselves are likely to introduce a degree of resonance, which will change the frequency response of headphones to the ear.
Further identified causes of variation were the different headband designs and tensions. The audiometer that performed the most consistently was the audiometer with the tightest headphones. These effects are likely to be greater in real world environments due to variability in the sizes and shapes of human heads. In addition, the artificial head used in this study remained still, whereas human heads will probably move during testing, which could cause greater variations.
The authors also commented on the difficulty of positioning the attenuating cups over the ears, due to reduced visibility of the transducer part of the headphone. This variation is also likely to occur in real subjects, which demonstrates a difference between the ‘calibrated’ set up and the ‘clinical’ set up. It is suggested that the position of the headphones is particularly significant at 6 kHz.
The authors concluded[xiv] that:
(i) To improve the accuracy of audiometry, headband tension needs to be sufficiently high to ensure good coupling between the ear and headphone and different headphones or tensions may be appropriate to different sizes of head;
(ii) Attenuating cups significantly increase variability and should be avoided;
(iii) The high proportion of people with threshold shifts at 6 kHz could be linked to the variation in performance of the headphones when placed slightly differently or with insufficient tension on the ears;
(iv) You can expect variations of up to 21 dB in hearing thresholds at some frequencies if tested in different clinics. You can also expect a high degree of variation for different tests within the same clinic using the same audiometer. ‘Real world’ differences are likely to be greater than shown in the study;
(iv) The degree of variability found within the study is sufficient to cause misdiagnosis of NIHL on a single audiogram;
(v) Despite being regularly referred to as the ‘gold standard’, pure tone audiometry, as it currently stands, has a very high degree of potential error, particularly in a real world environment.
The same authors then followed this study by looking at the variation of measurements in both laboratory conditions and real world/clinical conditions. The methodology for testing laboratory conditions was as described above using the HATS. To test in a clinical/real world environment 13 people were recruited from the University community - some with normal hearing and some with hearing problems. Testing was carried out by a qualified audiometrist in accordance with the BSA recommended procedures for PTA using 3 different audiometers and TDH39 headphones. As expected the variation in clinical conditions (for the 13 test subjects) was even greater than for a laboratory conditions (using the HATS).
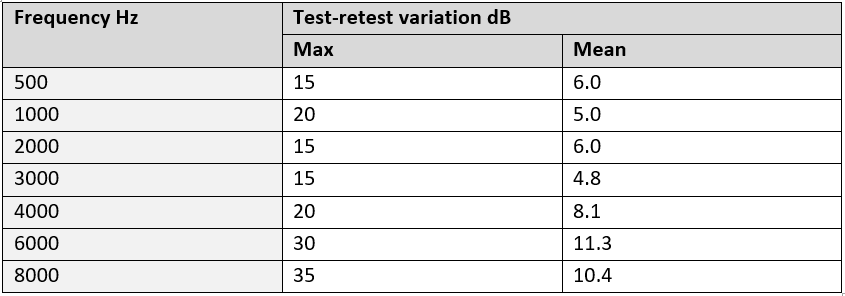
At the key frequencies of 3, 4 and 6 kHz the mean differences were between 5-12 dB but the maximum differences were 15 dB, 20 dB and 30 dB respectively. The results are reproduced in the table and figure below.
Table and figure: Maximum and mean variations in sound outputs
The authors stated:
‘All frequencies had a maximum error of at least 15 dB in the clinical tests, which brings into question the accuracy of clinical pure tone testing as the primary mode of hearing screening, as this degree of error is sufficient to cause misdiagnosis’.
CONCLUSIONS
When using the CLB Guidelines[xv] as a diagnostic framework for NIHL, small differences in hearing thresholds matter. A 5-10 dB difference at a single threshold can change a +diagnosis to a –diagnosis.
The Institute of Sound & Vibration Research in a 2015 Technical Report,[xvi] summarised the position on diagnosis of NIHL based on a single audiogram as follows:
“A single determination of hearing threshold level at any frequency must be recognised as only a guess of unknown accuracy.”
“For an individual test subject, a single audiogram is an unconfirmed determination of that individual’s state-of-hearing in both ears. Put more starkly, a single audiogram is a guess.”
The recent studies by Southampton Solent University suggest that the typical variability of pure tone audiometry is greater than previously thought. Differences far greater than the 10 dB ‘accepted margin of error’ may in fact be typical. These differences arise even where the audiometry is performed in accordance with BSA Recommended procedures for pure tone audiometry. Where audiometry is sub-standard then expect the differences to be even greater and showing worse than true hearing thresholds.
Let’s consider the findings of these recent studies in the context of the current NIHL market:
In our view, single audiometry handling schemes would:
(i) result in over-diagnosis of NIHL;
(ii) lead to reduced repudiation rates and more claims paid;
(iii) provide much needed cash flow to claimant organisations, and:
(iv) re-ignite a currently declining market.
Ask yourself what are the benefits of adopting a single audiometry handling scheme in the current market?
In a future feature we look at the results of repeat audiometry obtained by BC Legal. In what % of claims is the audiometry consistent and reliable such that diagnosis can be validated? In what % of claims does repeat audiometry show thresholds significantly different from the claimant audiometry? In how many of such claims does the repeat audiometry provide a defence on causation?
[i] British Society of Audiology, ‘Recommended Procedure: Pure-Tone Air-Conduction And Bone-Conduction Threshold Audiometry With And Without Masking’ (British Society of Audiology, 9th September 2011, Amended February 2012).
[ii] http://www.manchesterlawsociety.org.uk/event/2016/10/18/whats-all-the-noise-about-noise-induced-hearing-loss/
[iii] Dominic Weir is Chair of the CJC Noise-induced Hearing Loss Working Group and Karen Jackson and Zoe Holland both sit on the Committee which we previously reported on in edition 105 of BC Disease News.
[iv] Stephens, S D G (1981). Clinical audiometry. In Audiology and Audiological Medicine, Vol.1 (ed. H.A. Beagley). Oxford: oxford University Press, 365-370
[v] Guide for Conservation of hearing in Noise (1988)
[vi] King, PF, Coles RRA, Lutman ME, Robinson DW (1992). Assessment of hearing disability. Guidelines for medico-legal practice. London: Whurr Publishers
[vii] [2007] EWHC B1 (QB)
[viii] B.W. Lawton, ‘Perspectives On Normal And Near-Normal Hearing’ (University of Southampton, Report No 200, October 1991).
[ix] Davison, L. G., Barlow, C., Ashmore, M., Weinstein, R. Variances in the Audiogram Data of Individuals Undertaking Audiometry on Different Calibrated Audiometers, August 7 2013.
[x] Barlow CA et al. Amplitude variation in calibrated audiometer systems in clinical simulations. Noise Health 2014;16:299-305.
[xi] Barlow, C., Davison, L. & Ashmore, M. Variation in tone presentation by pure tone audiometers: the potential for error in screening audiometry. EuroNoise 31 May – 3 June 2015.
[xii] For example BS EN ISO 389-1: 2000 Acoustics-Reference zero for the calibration of audiometric equipment. Part 1: Reference equivalent thresholds for pure tones and supra aural headphones: BSI 2000
[xiii] https://bksv.com/Products/transducers/ear-simulators/head-and-torso/hats-type-4128d?src=fnt
[xiv] See not only study but Letter to Editor in, Barlow CA et al. Concerns with amplitude variation in calibrated audiometer systems in clinical simulations Noise Health 2015;17:384-5.
[xv] R.R.A. Coles, M.E. Lutman & J.T. Buffin (2000) Guidelines on the diagnosis of noise-induced hearing loss for medicolegal purposes, Clin. Otolaryngol. 2000, 25, 264-273.
[xvi] B.W. Lawton, ‘ISVR Technical Report: Variability Of The Threshold Of Hearing: Its Importance In Cases Of Noise-Induced Hearing Loss’ (University of Southampton, Report No 336, April 2015).
[xvii] UK Deafness Working Party, ‘Summary Data – 2015(Q4)’ (Institute and Faculty of Actuaries).
[xviii] Lutman M.E., R.R.A Coles, Buffin J.T. (2015) Guidelines for quantification of noise-induced hearing loss in a medicolegal context, Clin. Otolaryngol. 2016 Aug;41(4):347-57.